BLOG09b: CPU & Memory Metrics — The Real Heartbeat of HPA

BLOG23: CPU & Memory Metrics — The Real Heartbeat of HPA
image

1. CPU & Memory Metrics — The Real Heartbeat of HPA

HPA listens to metrics like a stethoscope. But unlike humans, its heartbeats come in millicores and MiB.


CPU — the millicore universe

Kubernetes measures CPU in millicores (mCPU).

  • 1000 millicores = 1 CPU core

  • A CPU request of 250m = 25% of one core

  • A limit of 2000m = 2 full cores

⚡ Why millicores?

Because pods sip CPU in tiny gulps, not whole cores. Millicores give Kubernetes fine-grained control.


CPU Utilization Formula (absolutely key!)

If a pod requests 500m CPU…

And it is using 250m according to metrics-server…

Then:

HPA compares actual utilization to the target (e.g., 70%).

➡️ If actual > target → scale up ➡️ If actual < target → scale down

Crucial: CPU limits are not used for autoscaling. HPA compares usage vs requests only.


2. Memory — the MiB universe

Memory in Kubernetes is measured in:

  • Bytes

  • MiB (Mebibytes = 1,048,576 bytes)

  • GiB

Kubernetes uses MiB, not MB, to stay faithful to binary.

Memory is not compressible, unlike CPU.

If you exceed CPU, you slow down. If your application uses more memory than allocated, the pod will be OOMKilled (terminated due to Out-Of-Memory).

Memory autoscaling is rare

Unlike CPU:

  • Memory doesn’t fluctuate rapidly

  • Memory keeps increasing and never “goes down” unless app frees it

  • Memory spikes often mean memory leaks (not load)

HPA usually uses CPU-based scaling, not memory.


3. HPA Cooldown Period — the “patience timer”

HPA isn’t trigger-happy. It waits… watches… and then scales.

There are three key timing concepts:


A. Stabilization Window (default 300s for scale-down only)

This is the cooldown period.

  • When load drops, HPA waits 5 minutes before scaling down.

  • Prevents flapping like:

You can customize it:


B. Scale-Up "Forgetting Window" (default 15 seconds)

This one is for aggressiveness.

If load increases:

  • HPA checks CPU every 15 seconds

  • If it sees sustained overload → instant scale-up

Scale-up is fast. Scale-down is slow.

This is on purpose.


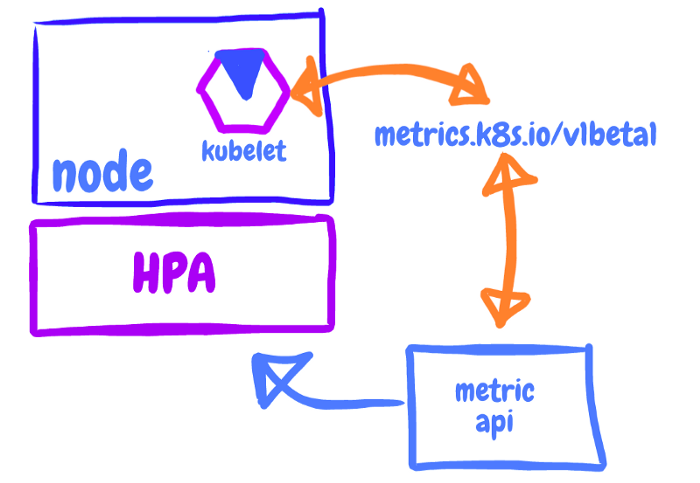
C. Kubelet Metrics Delay (~15s → 30s)

Metrics-server scrapes kubelet:

  • Every 15 seconds

  • HPA reads metrics around every 15 seconds

So total time from CPU spike → HPA decision is:

15s (scrape) + 15s (HPA polling) = ~30 seconds

That’s why you feel a slight lag when spamming your prime number app.


4. Why HPA scaling works best with CPU & not memory

CPU scaling signals:

  • CPU increases when more users hit the API

  • CPU decreases when load drops

  • Very reactive

  • Good for “spiky” workloads

Memory:

  • Memory often increases due to cache or leaks

  • Doesn’t drop until GC frees it

  • Scaling on memory often leads to unnecessary pods

This is why production HPAs almost always use CPU.


5. The "Moving Average" Mental Model (How HPA thinks)

HPA doesn’t react to one measurement.

It reacts to:

  • Sustained demand (scale-up)

  • Sustained calm (scale-down)


6. Your Prime App Autoscaling Example

Your prime calculator app has superb CPU behavior:

  • The algorithm is CPU-bound

  • Every call generates predictable CPU load

  • Perfect for HPA

If your target is 70% CPU, and each pod uses:

  • ~300m CPU under load

  • request = 200m

Then utilization = 150% → scale-up.

A storm of pods is born. 🌪️

When load drops:

  • They stay alive for 300 seconds

  • Then scale-down gradually


Last updated